INTRODUCTION
TRACK RECORD OF VALUE CREATION
OUR SHOPPERS' SPEAK
OUR TENANTS SPEAK
|
TRACK RECORD OF VALUE CREATION |
| |
|
(1) |
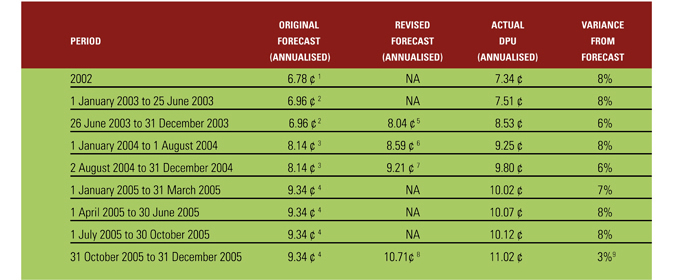
CONSISTENTLY OUTPERFORMED DISTRIBUTION PER UNIT FORECAST |
| |
• |
We have consistently outperformed our Distribution per Unit forecasts by between
3.0 percent to 8.0 percent. |
|
 |
1 |
Annualised forecast based on the forecast shown in the CMT Offering Circular
dated 28 June 2002. |
2 |
Based on the forecast shown in the CMT Offering Circular dated 28 June 2002.
|
3 |
Based on the forecast shown in the CMT Circular dated 11 June 2003.
|
4 |
Based on the forecast shown in the CMT Circular dated 20 July 2004.
|
| 5 |
Based on the forecast shown in the CMT Circular dated 11 June 2003, for all the
properties, excluding Plaza Singapura, for the period June
to December 2003, pro-rated for the period from 26 June
to 31 Decem ber2003. |
6 |
Based on the forecast shown in the CMT Circular dated 11 June 2003 (and subsequently
updated in the CMT Offer Information Statement dated
9 December 2003) for all the properties, excluding
Plaza
Singapura, for the fi nancial year ended 31 December 2004,
pro-rated for the period from 1 January to 1 August
2004. |
7 |
Based on the forecast shown in the CMT Circular dated 20 July 2004, for all the
properties including Plaza Singapura, for the period 1
August to 31 December 2004, pro-rated for the period from
2 August to 31 December
2004. |
8 |
Based on the forecast shown in the CMT Circular dated 18 October 2005 (adjusted
to include actual distribution for 31 October 2005). |
9 |
Variance against the revised forecast of 10.71 cents as shown in the CMT Circular
dated 18 October 2005 (adjusted to include actual distribution
for 31 October 2005). |
|
(2) |
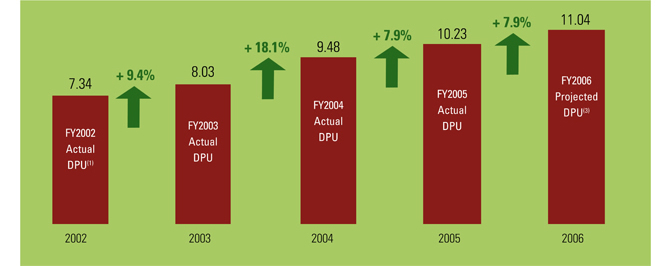
DISTRIBUTION PER UNIT GROWTH TREND |
| |
• |
Actual Distribution per Unit has grown from 7.341 cents in 2002 to 10.232 cents
in 2005. |
|
|
1 |
Based on annualised distribution per unit. The actual distribution per unit for
the period from 17 July 2002 to 31 December 2002 was
3.38 cents. |
2 |
Based on actual distribution per unit from 1 January 2005 to 31 December 2005.
|
3 |
Based on the forecast shown in the CMT Circular dated 18 October 2005.
|
|
| (3) |
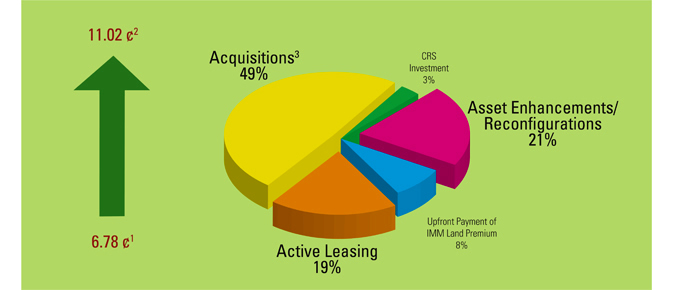
CORE DRIVERS OF DISTRIBUTION PER UNIT GROWTH |
| |
• |
We have successfully driven Distribution per Unit growth from 6.78 1 cents to
11.022 cents, with acquisitions (49 .0 percent), asset enhancements/reconfi
gurations (20.5 percent) and active leasing (19.2 percent)
forming the threemajor components of growth. |
|
 |
| 1 |
Annualised forecast based on the forecast, together with the accompanying assumptions,
shown in the CMT Offering Circular dated 28 June 2002. |
2 |
Annualised distribution per unit for the period 31 October 2005 to 31 December
2005.
|
3 |
Based on the distribution per unit increase forecasts shown in the CMT Circular
dated 11 June 2003, CMT Circular dated 20 July 2004 and CMT
Circular dated 18 October 2005, which were eventually achieved.
|
|
|
|
|
|
|
|
|