55
CapitaLand Mall Trust
Annual Report 2015
Overview
Sustainability
Business
Review
Portfolio
Details
Corporate
Governance &
Transparency
Comparative Price Trends
CMT
STI
FTSE ST RE Index FTSE ST REIT Index
Closing
Unit
Price
(S$) Index
1
Closing
Index
Value
Rebased
Index
1
Closing
Index
Value
Rebased
Index
1
Closing
Index
Value
Rebased
Index
1
Dec 2014
2.040 100.0 3,365.15 100.0
755.98 100.0
779.50 100.0
Jan 2015
2.090 102.5 3,391.20 100.8
789.89 104.5
796.80 102.2
Feb 2015
2.110 103.4 3,402.86 101.1
803.13 106.2
805.26 103.3
Mar 2015
2.200 107.8 3,447.01 102.4
806.08 106.6
807.62 103.6
Apr 2015
2.190 107.4 3,487.39 103.6
819.58 108.4
802.45 102.9
May 2015
2.170 106.4 3,392.11 100.8
818.27 108.2
795.76 102.1
Jun 2015
2.150 105.4 3,317.33
98.6
789.58 104.4
779.50 100.0
Jul 2015
2.000
98.0 3,202.50
95.2
752.43
99.5
752.60
96.5
Aug 2015
1.920
94.1 2,921.44
86.8
697.84
92.3
700.07
89.8
Sep 2015
1.900
93.1 2,790.89
82.9
675.28
89.3
693.88
89.0
Oct 2015
1.980
97.1 2,998.35
89.1
722.92
95.6
722.93
92.7
Nov 2015
1.905
93.4 2,855.94
84.9
685.29
90.6
693.80
89.0
Dec 2015
1.930
94.6 2,882.73
85.7
701.61
92.8
695.93
89.3
Source: Bloomberg.
1 Illustrates the change from the base value as at end-December 2014.
Jan
2015
Feb
2015
Mar
2015
Apr
2015
May
2015
Jun
2015
Jul
2015
Aug
2015
Sep
2015
Oct
2015
Nov
2015
Dec
2015
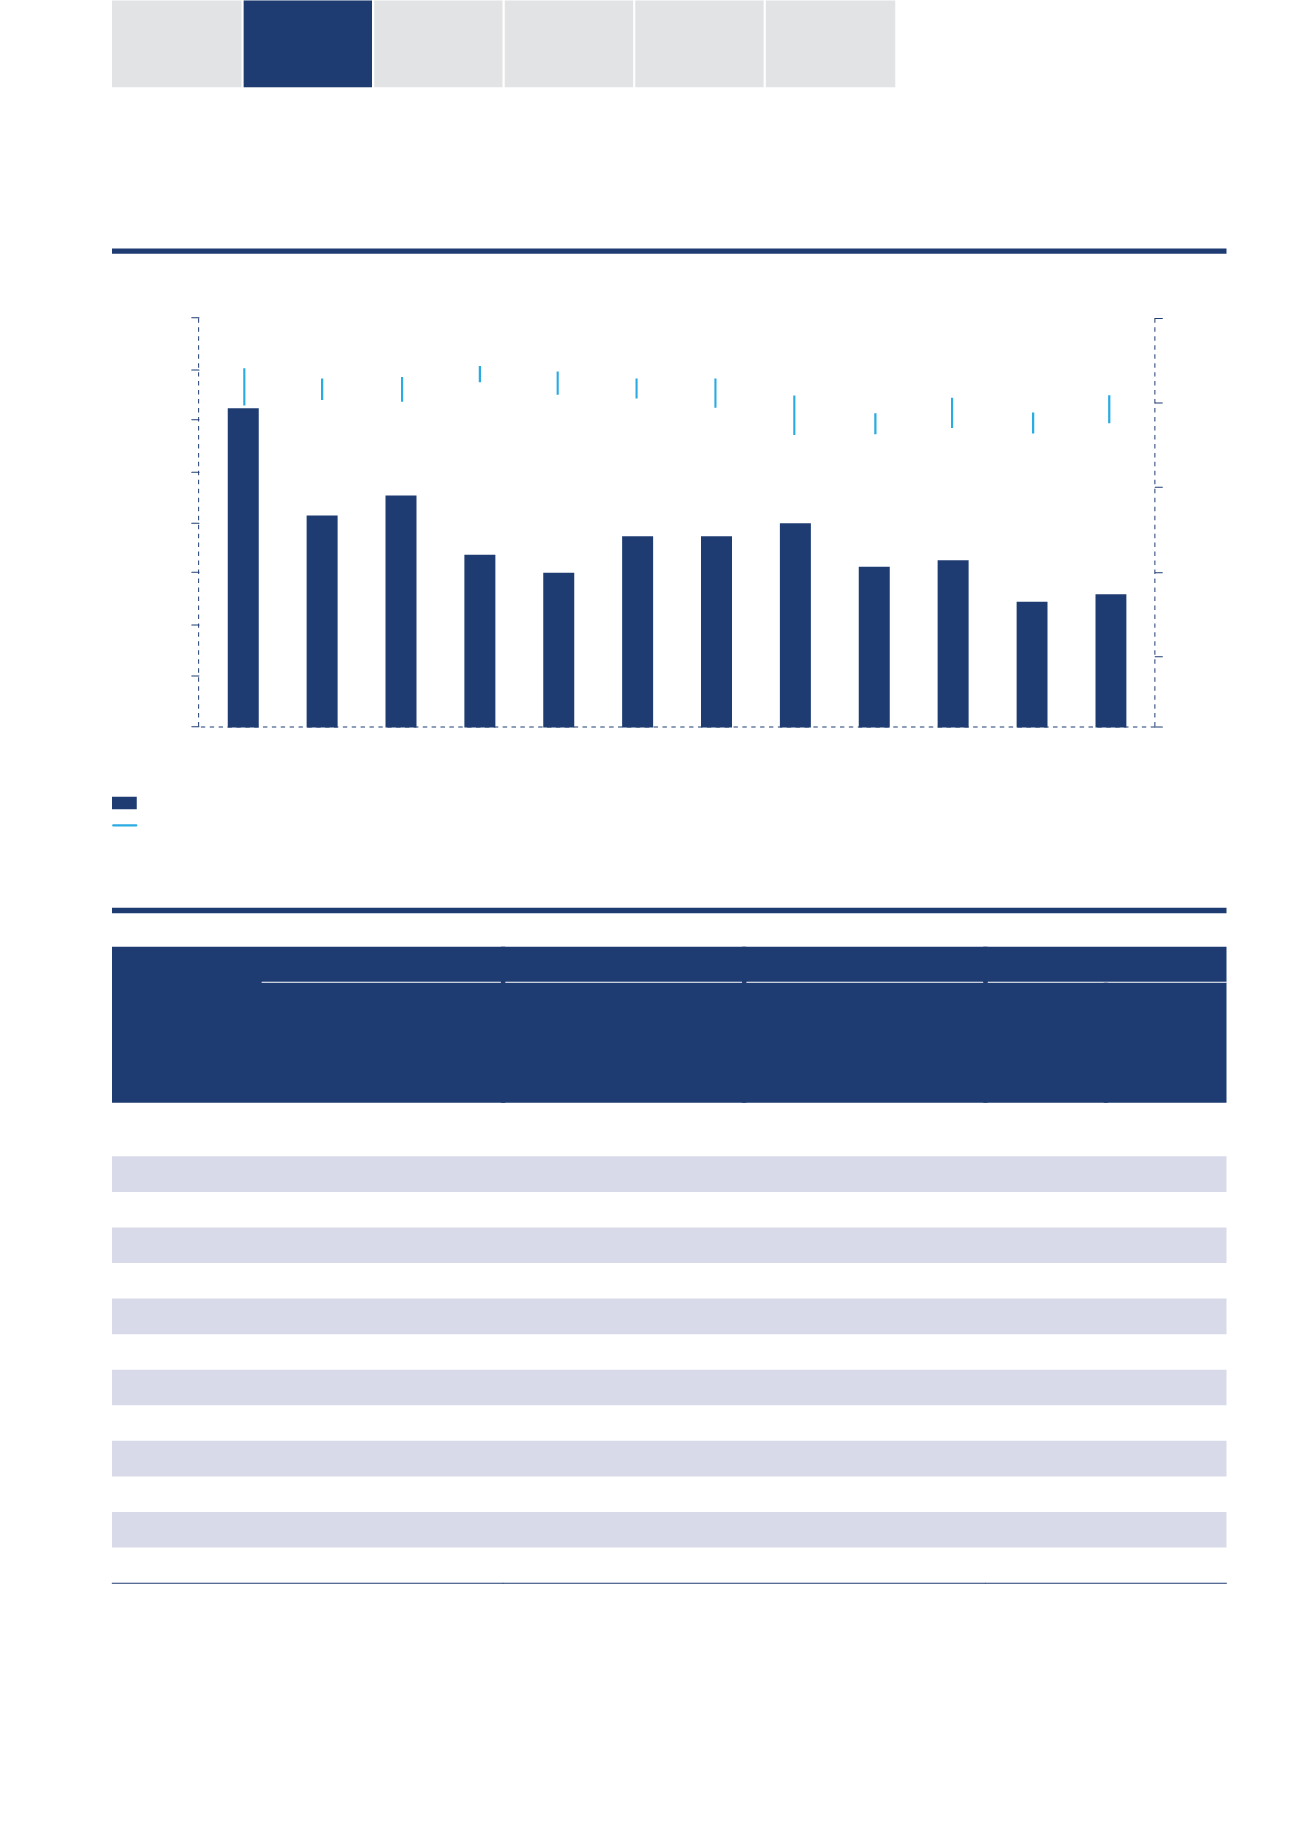
CMT’s Monthly Trading Performance
Trading Volume (million units)
Highest and Lowest Unit Prices (S$)
400
350
300
250
200
50
100
0
150
0.0
0.5
1.0
1.5
2.0
2.5
Trading Volume (million units)
Highest and Lowest Unit Prices (S$)
Financials &
Additional
Information


