60
CapitaLand Mall Trust
Annual Report 2015
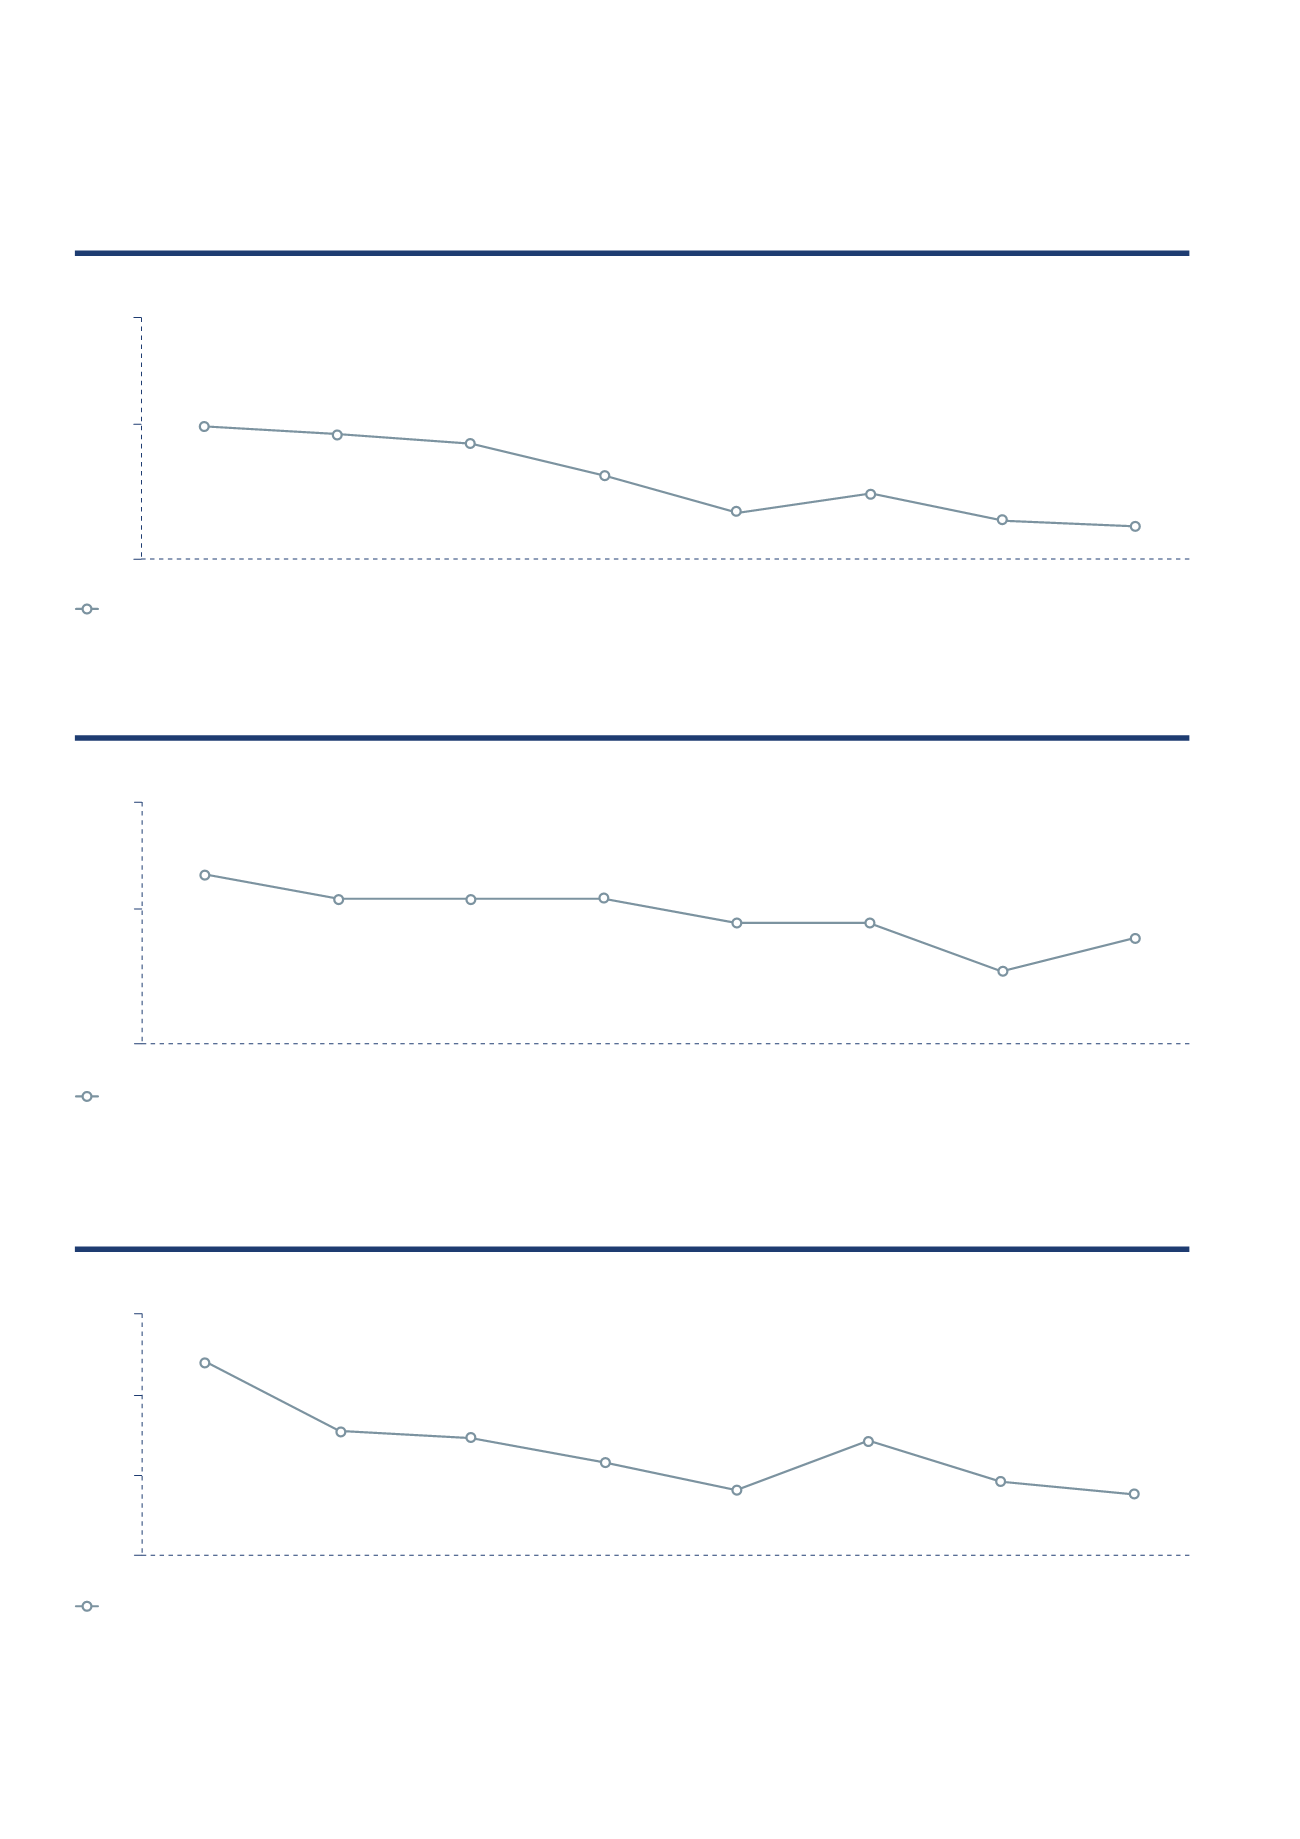
Energy Efficiency Index
Water Efficiency Index
2
Carbon Emission
2015
1
2015
1
2015
1
2011
2011
2011
2012
2012
2012
2008
2008
2008
2009
2009
2009
2010
2010
2010
2013
2013
2013
2014
2014
2014
kWh/m
2
: kilowatts-hour per square metre
m
3
/m
2
: cubic metre per square metre
Sustainability Management
1
Excludes Bedok Mall which was acquired on 1 October 2015 and Rivervale Mall which was sold on 15 December 2015.
2 Restated to actual water consumption.
In 2015, our total energy consumption recorded 141.9 megawatt hours. We managed to reduce our energy
usage by 20.2% in 2015 compared to 2008.
Our total water consumption stood at 1,677,613 cubic metres in 2015. We reduced our water usage by 10.5%
compared to 2008. Compared to the previous year, the higher water usage was mainly due to asset enhancement
works and the increase in shopper traffic during the year.
In terms of carbon emission, we recorded 65,017 tonnes in 2015. We reduced our carbon emission by 30.4%
in 2015 compared to 2008.
25.00
0.25
12.00
20.00
0.20
10.00
8.00
15.00
0.15
6.00
kg/m
2
: kilogramme per square metre


